PHAK Ch. 4 & 11 · study note
Density altitude & performance
Density altitude is how pilots talk about “how thin the air is today.” Thin air means less mass for the engine to burn with, less grip for the propeller, and less aerodynamic force from the wing at a given indicated airspeed—so takeoff rolls grow and climb suffers.
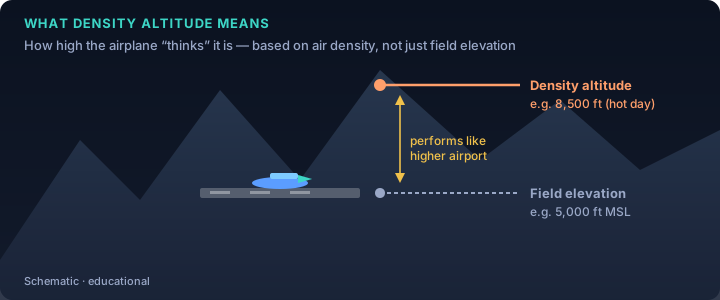
Formal definition
In the Pilot’s Handbook of Aeronautical Knowledge, density altitude is pressure altitude corrected for nonstandard temperature. When the atmosphere matches the standard atmosphere at that level, density altitude equals pressure altitude.
Pressure altitude is height above the standard datum plane (29.92 inHg). A common field estimate:
(29.92 − altimeter setting) × 1000 + field elevation
For the mental models behind PA, DA, ISA, and the ~120 ft/°C rule, see Altitude math mental models.
What thins the air?
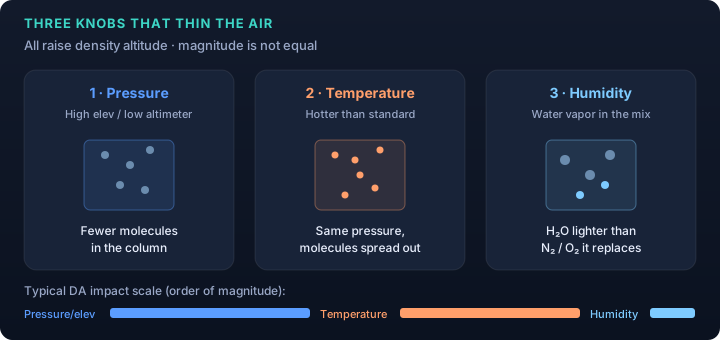
| Factor | Effect | Typical scale |
|---|---|---|
| High elevation / low pressure | Less air mass in the column | Thousands of feet of DA |
| High temperature | Air expands; lower density at a given pressure | Thousands of feet of DA |
| High humidity | Water vapor is lighter than dry air (H₂O ≈ 18 g/mol vs dry air ≈ 29), so moist air is less dense | Usually hundreds of feet |
Mnemonic for the worst combination: hot, high, and humid.
Humidity in more detail
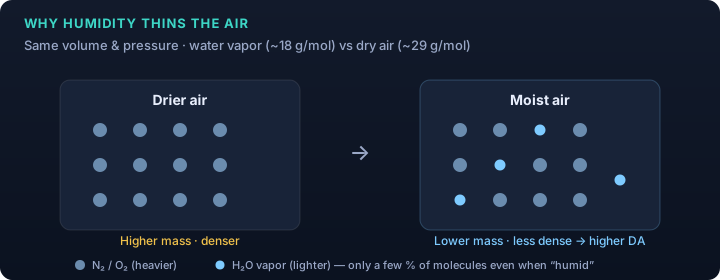
PHAK (Ch. 4 and Ch. 11) states that humidity contributes to density altitude and performance, but is usually not treated as an essential chart input. There is no simple cockpit humidity axis on most light-airplane takeoff charts. Still, expect worse performance when it is both hot and moist.
Safety publications (e.g. FAASTeam density-altitude pamphlet) often suggest adding margin on humid days— for example on the order of +10% takeoff distance—and anticipating a weaker climb. That is a heuristic, not a substitute for the AFM/POH.
What high DA does to the airplane
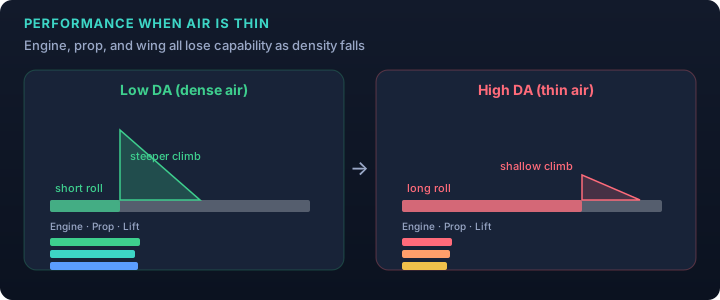
Other performance factors (same day, fixed DA)
Even with the same density altitude, mission outcome changes with:
- Weight — often the biggest non-weather lever
- Wind — headwind shortens ground roll; tailwind hurts
- Runway surface & slope — grass/soft and uphill takeoffs cost distance
- Configuration — flaps and other settings per the POH
Operational loop
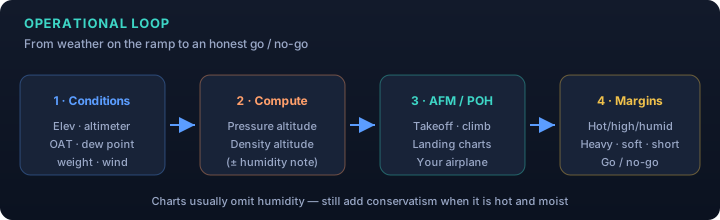
- Get elevation, altimeter, OAT (and notice dew point on the METAR).
- Find pressure altitude, then density altitude (PA + temperature; optional humidity-aware tool).
- Read takeoff, climb, and landing from the AFM/POH for that airplane.
- Add margins when hot, high, humid, heavy, soft, or short—and go or no-go honestly.
Practice it
The interactive lab lets you move the atmosphere knobs (including humidity), then stack weight, wind, and runway factors. Numbers there are educational models—not certified performance.
Open Aircraft Performance Lab →
Primary sources
- FAA PHAK FAA-H-8083-25C — Ch. 4 (humidity on density), Ch. 11 (performance)
- FAA-P-8740-2 Density Altitude (hot/high/humid safety pamphlet)
- AC 00-6B Aviation Weather (formal DA definition centers on PA + temperature)
Figures on this page are original educational schematics (SVG), not scans of FAA handbook art.